“It’s too hot to even commute to the lake…’’ another WhatsApp message arrives. That’s one person less coming to a lake on the outskirts of Berlin to escape the trapped heat in the city. The heat is everywhere – we feel it, read about it, and complain about it because it’s real.
During extreme days of heat in cities, so-called heat islands can form due to the high density of buildings and sealed surfaces and because the temperature does not even drop much lower at night than during the daytime. According to Dr Katharina Scherber, Chair of Climatology, the heat islands also cause more people suffering from heat stress to have to come to hospitals in the city of Berlin, compared to the state of Brandenburg, the region around Berlin.
On the upside, there are various regions and cities across Europe which are mapped to guide citizens to cooler and wetter areas in periods of extreme heat. The maps are a tool for citizens, rather than a direct adaptation measure. I love maps and Berlin’s urban heat scares me these days, so I wanted to take a closer look.
A very direct response to avoid heat stress is to stay in cold spaces indoors and to stay hydrated if possible.
However, usually one needs to commute somewhere during the day – whether it’s for work, school or just to see friends. There are vast differences within each city as to when and where there is extreme heat. Both factors are accounted for in several maps of European cities, some of which the members of the REGILIENCE consortium live in.

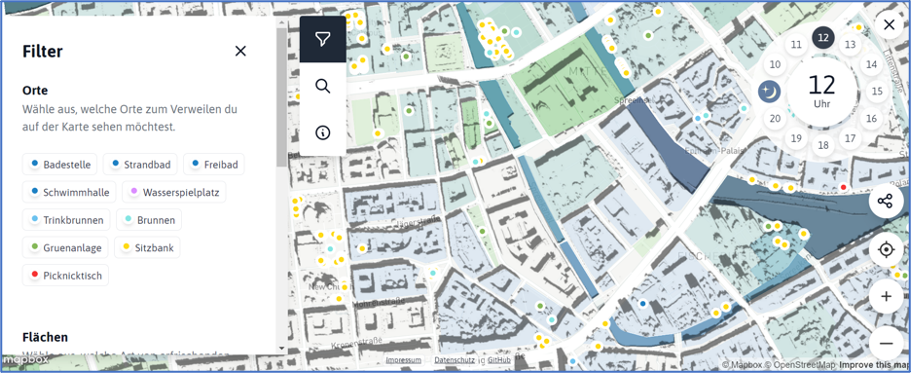
The map in Berlin is called Refreshing map (Erfrischungskarte) and was developed by the open data information centre (ODIS) which strives to make the vast data from the public administration digital and usable. By compiling the data the map shows citizens where there is more shade, cooler areas and water stations in the city. The idea arose because the team wanted to test the shadow maps with a mapping tool by QGIS based on the 1×1 m digital terrain model of Berlin. They also wanted to create a useful tool for day-to-day life to „help everyone to adapt to urban heat and to help raise awareness’’, says Lisa Stubert, who leads ODIS.
On the question about how easy it would be to create a map of the entire region, she says there could most likely only be a few features because of a lack of data.
In other parts of Europe, it is also only urban areas, not regions, that have informative heat maps for citizens: An app, Extrema global shows where cooler zones and water stations are across some of Europe’s biggest cities. In direct collaboration with Rotterdam, there is also the Extrema Rotterdam app, which has an Emergency Notification System for Extreme Temperatures and an information management tool to inform citizens about how to get from point A to B in the coolest way possible.

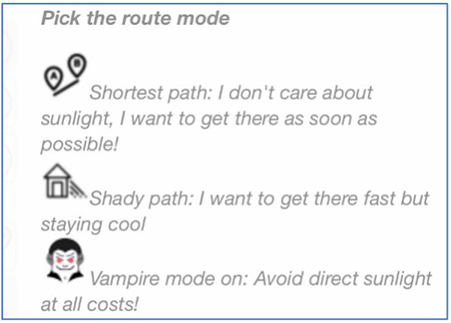
For this, the map of Barcelona, which only covers the coastal districts of Barcelona, offers three modes to choose from so that users can set their own preferences. Shadows are included in the maps (Berlin), a colour spectrum to visualize the differences in temperature (Berlin, Barcelona, all Extrema maps), and there are some maps that feature spots to take a rest such as benches (Berlin) or shelters (Barcelona). The Viennese Map has different types (and icons) for refreshment: spray showers, drinking water stations and water sprinklers.
The maps also provide the necessary information about how to stay cool and hydrated. Thanks to them it will be easier for the commuters to decide whether it is actually a good idea to go to the lake!
When it comes to adaptation to climate change overall, initiatives arise from the bottom-up or in response to calls for building more resilience. Within our work for REGILIENCE we often observe that cities are in fact the pioneers in resilience efforts. We learn through these initiatives what is possible and what may work, also for the regions.
If you want to make your region more climate-resilient contact us or subscribe to our newsletter.
You can download the article here.